


Code is like humor. When you have to explain it, it’s bad.
© Cory House
Introduction
We all know that the code should be self-documenting, clean, and elegant. Most important - it should work and produce value. But how would you tell a story about tens or hundreds of various components, their interconnection, actors, use cases, and overall system landscape? This is extremely important for quick onboarding new team members and sharing knowledge within a team about technical aspects of a product and business workflows. There are plenty of ways to document: from standards like ANSI/ANS 10.3-1995 used in some big enterprises, UML diagrams to no documentation at all. These all are edges of a full spectrum. The truth like in most cases lies somewhere in between.
In this post, I share a few tips on some pragmatic approaches you could use for documenting your software systems that give the most value with minimum effort and cost.
Approach
Let's define what we would like to achieve and why:
- Reflect system design, interactions, and actors
- Knowledge sharing
- Simplify onboarding for new members
- Mitigate bus factor
This is achievable by splitting into levels:
- [Source Code] - PR reviews, pair programming, following best practices and conventions for writing clean and readable code
- [Component] - Component diagram
- [Container] - Container diagram
- [System Context] - System context diagram
I find it more practical to focus on high-level architecture (HLA) diagrams for system context, landscape, services, and components. On a source code level describing all relations, states, and flows of control are too overwhelming in my opinion, so having regular PR reviews and pair programming sessions together with following established in team code conventions, will better serve the purpose of knowledge sharing. However, I should admit that sequence diagrams are very useful for explaining some complex workflows.
Nearly every platform like Azure DevOps, GitLab, GitHub has a built-in Wiki. It is a good way to describe anything related to the project or product. We use it for documenting deployments, configurations, how-tos, etc.
Diagrams as a code
The modern tendencies in the software industry come to the stage, where it is more productive and beneficial to treat everything as a code. As an example, I bet you have heard of Infrastructure as Code (IaC) with practices like GitOps where the key idea is to use a source code as a descriptive model for infrastructure management (networks, virtual machines, load balancers, etc.). It is the same idea familiar to every software developer where the same source code generates the same binary but is applied to infrastructure.
By using this approach for documentation and diagrams we can apply the same principles here: idempotence, versioning, decoupling from concrete tooling.
Diagrams as a code is becoming very popular way of describing software systems. Tools like PlantUML, Memraid, WebSequenceDiagrams and others are gaining momentum.
C4 Model
All joking aside, these diagrams do suffer from one or more of the following problems:
• Notation (e.g. colour coding, shapes, etc) is not explained or is inconsistent.
• The purpose and meaning of elements is ambiguous.
• Relationships between elements are missing or ambiguous.
• Generic terms such as “business logic” are used.
• Technology choices (or options, if doing up front design) are omitted.
• Levels of abstraction are mixed.
• Too much or too little detail.
• No context or a logical starting point.
© Simon Brown, Software Architecture for Developers: Volume 2 - Visualise, document and explore your software architecture
No, I'm not going to blow anything up here, except your mind. C4 model is a name for a method for visualizing software architecture. For 5 minutes intro to the C4 model, please follow this link. You don't need to know all UML vocabulary to describe your system in a clear and meaningful way. I will use the C4 model for the rest of the article.
Diagrams as text
Many of us used to create diagrams by using tools like Visio, ArchiMate or draw.io. We don't want to go this way and will use text-based domain-specific language (DSL) instead. I've chosen Structurizr - a web-based rendering tool. It has a lot of features, including rendering diagrams that are interactive, animatable, and embeddable. There is an online DSL editor, very good documentation and it supports export to all kinds of other formats: PlantUML, C4-PlantUML, Mermaid, WebSequenceDiagrams, etc.
Diagrams as code
Another way to create diagrams is by using one of the libraries available for Java, .NET, TypeScript, PHP, and other languages. You can write a code in the preferred language with the use of abstractions available in Structurizr. This option is recommended for teams who want to use code to help build their software architecture model. Example of .NET client library. I'm not considering this option in the article.
Documentation in action
Time for the demo. Let's assume that we have a system that allows us to search and filter logs. The system also has a way of controlling who can access certain logs. I will go through different levels of software and show you what I use as documentation.
System context
This is an entry point of any software system. It shows a system in scope and its relationship with users and other systems. For bigger enterprises, you could include one more level - system landscape, which describes the relationship between different system contexts.
In the case of the log viewer system, we describe all sub-systems which it interacts with and actors:
workspace {

    model {

        org = group "Customer Organization" {
            user = person "User" "Any user within organization" "User"
            admin = person "Administrator"  "Users of organization with Administrator role" "Admin"
        }

        enterprise "NinjaCorp" {
            employee = person "Employee" "Internal employee" "Employee"
            email = softwareSystem "E-Mail System" "Internal Campaign System" "Existing System"
            auth = softwareSystem "Security" "Authorization API" "Existing System"
            persons = softwareSystem "Users Management" "Membership API" "Existing System"

            logViewerSystem = softwareSystem "Log viewer system" "Allows to search and filter for logs." {
                webApp = container "Log viewer application" "Web UI" "ReactJS" "Web Browser"
                webApi = container "Log viewer API" "Provides searching functionality via a JSON/HTTP API" ".NET 6.0 C# Web API"
                logViewerWorkflows = container "Log viewer workflows" "Provides functionality for workflows" "Go service"
            }
        }

        # relationships between people and software system
        logViewerSystem -> email "Sends e-mail using"
        logViewerSystem -> auth "Controls access to resources"
        logViewerSystem -> persons "Gets user's information"
        email -> employee "Sends e-mails when access approved or rejected."
        employee -> logViewerSystem "View logs. Helps customers to troubleshoot."
        user -> logViewerSystem "View logs."
        admin -> logViewerSystem "Views logs."
}

views {
        systemContext logViewerSystem "SystemContext" {
            include *
            autolayout
        }
    }
If you copy-paste it into the Structurizr DSL editor and click the Render button it will generate the following diagram :
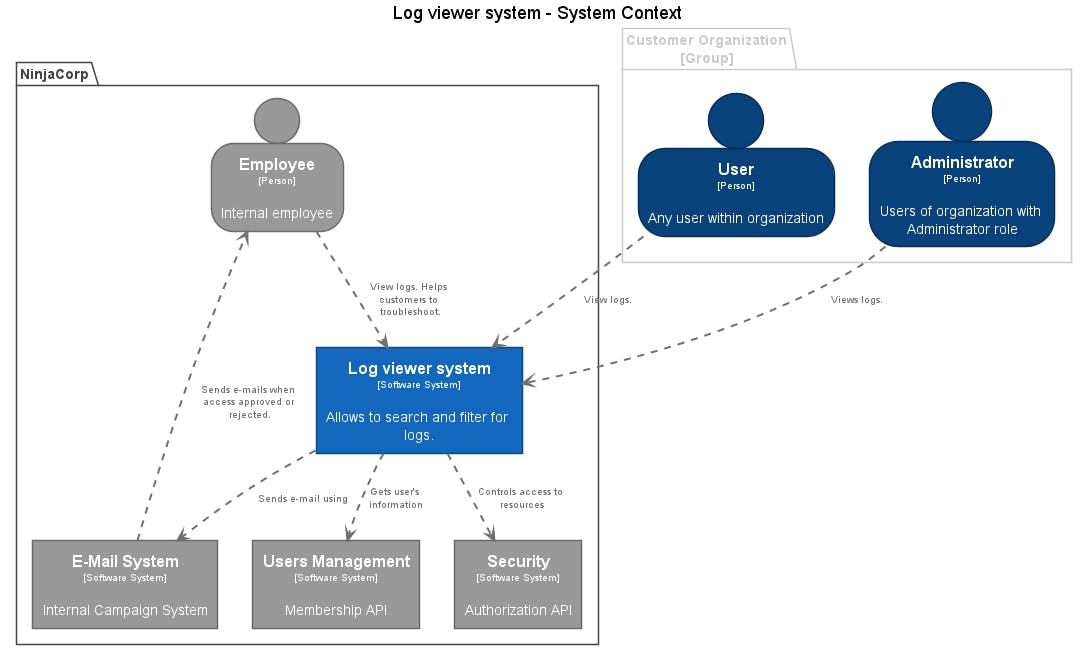
Every document starts with the workspace section where you describe actors, systems, and their relationships. For complete reference check official documentation. I think the code is pretty self-explanatory, so I do not go into detail on what does each line means.
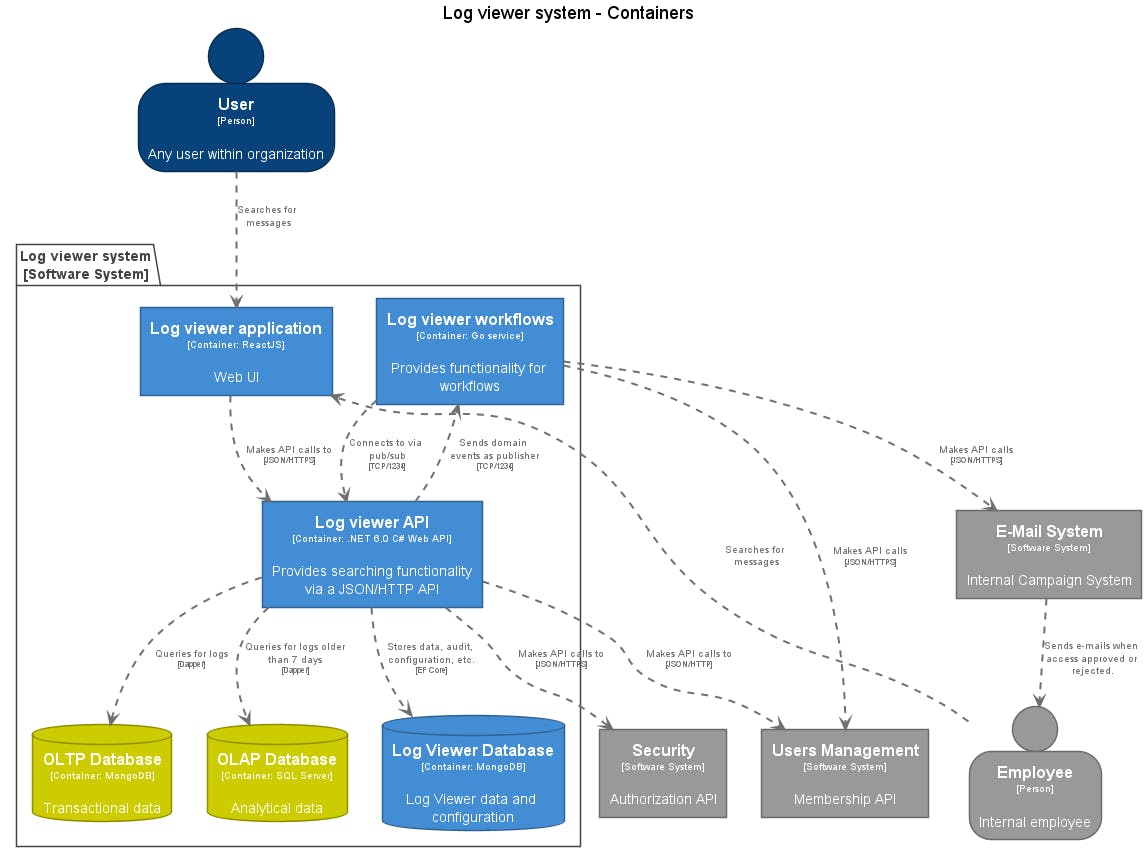
Container
Contains all the details of the container. Imagine that you zoom in into that rectangle representing the software system Log viewer system from the previous diagram. The previous DSL should be clarified in regards to how this system works. Let's do that.
An updated version of the JSON:
workspace {

    model {

        org = group "Customer Organization" {
            user = person "User" "Any user within organization" "User"
            admin = person "Administrator"  "Users of organization with Administrator role" "Admin"
        }

        enterprise "NinjaCorp" {
            employee = person "Employee" "Internal employee" "Employee"
            email = softwareSystem "E-Mail System" "Internal Campaign System" "Existing System"
            auth = softwareSystem "Security" "Authorization API" "Existing System"
            persons = softwareSystem "Users Management" "Membership API" "Existing System"

            logViewerSystem = softwareSystem "Log viewer system" "Allows to search and filter for logs." {
                webApp = container "Log viewer application" "Web UI" "ReactJS" "Web Browser"
                webApi = container "Log viewer API" "Provides searching functionality via a JSON/HTTP API" ".NET 6.0 C# Web API"
                logViewerWorkflows = container "Log viewer workflows" "Provides functionality for workflows" "Go service"
                logDatabase = container "Log Viewer Database" "Log Viewer data and configuration" "MongoDB" "Database"
                oltpDatabase = container "OLTP Database" "Transactional data" "MongoDB" "External Database"
                olapDatabase = container "OLAP Database" "Analytical data" "SQL Server" "External Database"
            }
        }

        # relationships between people and software system
        logViewerSystem -> email "Sends e-mail using"
        logViewerSystem -> auth "Controls access to resources"
        logViewerSystem -> persons "Gets user's information"
        email -> employee "Sends e-mails when access approved or rejected."
        employee -> logViewerSystem "View logs. Helps customers to troubleshoot."
        user -> logViewerSystem "View logs."
        admin -> logViewerSystem "Views logs."

        # relationships to/from containers
        user -> webApp "Searches for messages"
        employee -> webApp "Searches for messages"
        webApp -> webApi "Makes API calls to" "JSON/HTTPS"
        webApi -> auth "Makes API calls to" "JSON/HTTPS"
        webApi -> logDatabase "Stores data, audit, configuration, etc." "EF Core"
        webApi -> oltpDatabase "Queries for logs" "Dapper"
        webApi -> olapDatabase "Queries for logs older than 7 days" "Dapper"
        webApi -> logViewerWorkflows "Sends domain events as publisher" "TCP/1234"
        logViewerWorkflows -> webApi "Connects to via pub/sub" "TCP/1234"
        logViewerWorkflows -> email "Makes API calls" "JSON/HTTPS"
        logViewerWorkflows -> persons "Makes API calls" "JSON/HTTPS"
    }

    views {

        systemContext logViewerSystem "SystemContext" {
            include *
            autolayout
        }
        container logViewerSystem "Containers" {
            include *
            autolayout
        }
    }

}
The description was extended with details on which components are included in the Log viewer system and relations between them. The rendered version of the diagram now looks like this:
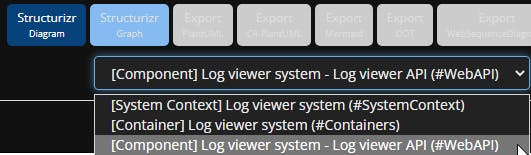
Notice that now you have several contexts available you can choose from: System Context and Container context:
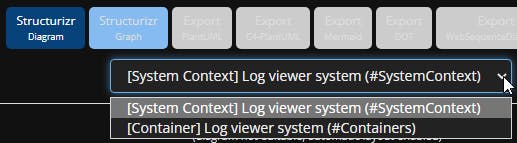
This is possible due to the presence of the views section which determines what kind of context should be rendered:
views {
        systemContext logViewerSystem "SystemContext" {
            include *
            autolayout
        }

        container logViewerSystem "Containers" {
            include *
            autolayout
        }
    }
Component
Now let's say we want to zoom into the Web API component of Log viewer system and describe the main components of it. To do that, let's clarify our DSL one more time:
workspace {

    model {

        org = group "Customer Organization" {
            user = person "User" "Any user within organization" "User"
            admin = person "Administrator"  "Users of organization with Administrator role" "Admin"
        }

        enterprise "NinjaCorp" {
            employee = person "Employee" "Internal employee" "Employee"
            email = softwareSystem "E-Mail System" "Internal Campaign System" "Existing System"
            auth = softwareSystem "Security" "Authorization API" "Existing System"
            persons = softwareSystem "Users Management" "Membership API" "Existing System"

            logViewerSystem = softwareSystem "Log viewer system" "Allows to search and filter for logs." {
                webApp = container "Log viewer application" "Web UI" "ReactJS" "Web Browser"
                webApi = container "Log viewer API" "Provides searching functionality via a JSON/HTTP API" ".NET 6.0 C# Web API" {
                    accessController = component "Access Request Controller" "Allows employees to request access to some logs" "Web API Controller"
                    logsController = component "Logs Controller" "Query logs" "Web API Controller"
                    publisher = component "Domain Events Publisher" "Triggers domain events" "NetMQ (ZeroMQ)"
                    audit = component "Audit Component" "Stores all commands to the Log Viewer for audit trail" "Audit.NET"
                    accessPolicy = component "Access Policy Component" "Access policies for access control to the logs" "Domain Service"
                }
                logViewerWorkflows = container "Log viewer workflows" "Provides functionality for workflows" "Go service"
                logDatabase = container "Log Viewer Database" "Log Viewer data and configuration" "MongoDB" "Database"
                oltpDatabase = container "OLTP Database" "Transactional data" "MongoDB" "External Database"
                olapDatabase = container "OLAP Database" "Analytical data" "SQL Server" "External Database"
            }
        }

        # relationships between people and software system
        logViewerSystem -> email "Sends e-mail using"
        logViewerSystem -> auth "Controls access to resources"
        logViewerSystem -> persons "Gets user's information"
        email -> employee "Sends e-mails when access approved or rejected."
        employee -> logViewerSystem "View logs. Helps customers to troubleshoot."
        user -> logViewerSystem "View logs."
        admin -> logViewerSystem "Views logs."

        # relationships to/from containers
        user -> webApp "Searches for messages"
        employee -> webApp "Searches for messages"
        webApp -> webApi "Makes API calls to" "JSON/HTTPS"
        webApi -> auth "Makes API calls to" "JSON/HTTPS"
        webApi -> logDatabase "Stores data, audit, configuration, etc." "EF Core"
        webApi -> oltpDatabase "Queries for logs" "Dapper"
        webApi -> olapDatabase "Queries for logs older than 7 days" "Dapper"
        webApi -> logViewerWorkflows "Sends domain events as publisher" "TCP/1234"
        logViewerWorkflows -> webApi "Connects to via pub/sub" "TCP/1234"
        logViewerWorkflows -> email "Makes API calls" "JSON/HTTPS"
        logViewerWorkflows -> persons "Makes API calls" "JSON/HTTPS"

        # relationships to/from components
        webApp -> accessController "Makes API calls to" "JSON/HTTP"
        publisher -> logViewerWorkflows "Sends domain events to" "TCP/1234"
        audit -> logDatabase "Stores into"
        logsController -> oltpDatabase "Queries from" "Dapper"
        logsController -> olapDatabase "Queries from" "Dapper"
        accessController -> logDatabase "Writes and reads"
        accessController -> persons "Makes API calls to" "JSON/HTTP"
        accessPolicy -> auth "Makes API calls to" "JSON/HTTP"
    }

    views {
        systemContext logViewerSystem "SystemContext" {
            include *
            autolayout
        }

        container logViewerSystem "Containers" {
            include *
            autolayout
        }

        component webApi "WebAPI" {
            include *
            autoLayout
        }
    }

}
This produces the following diagram:
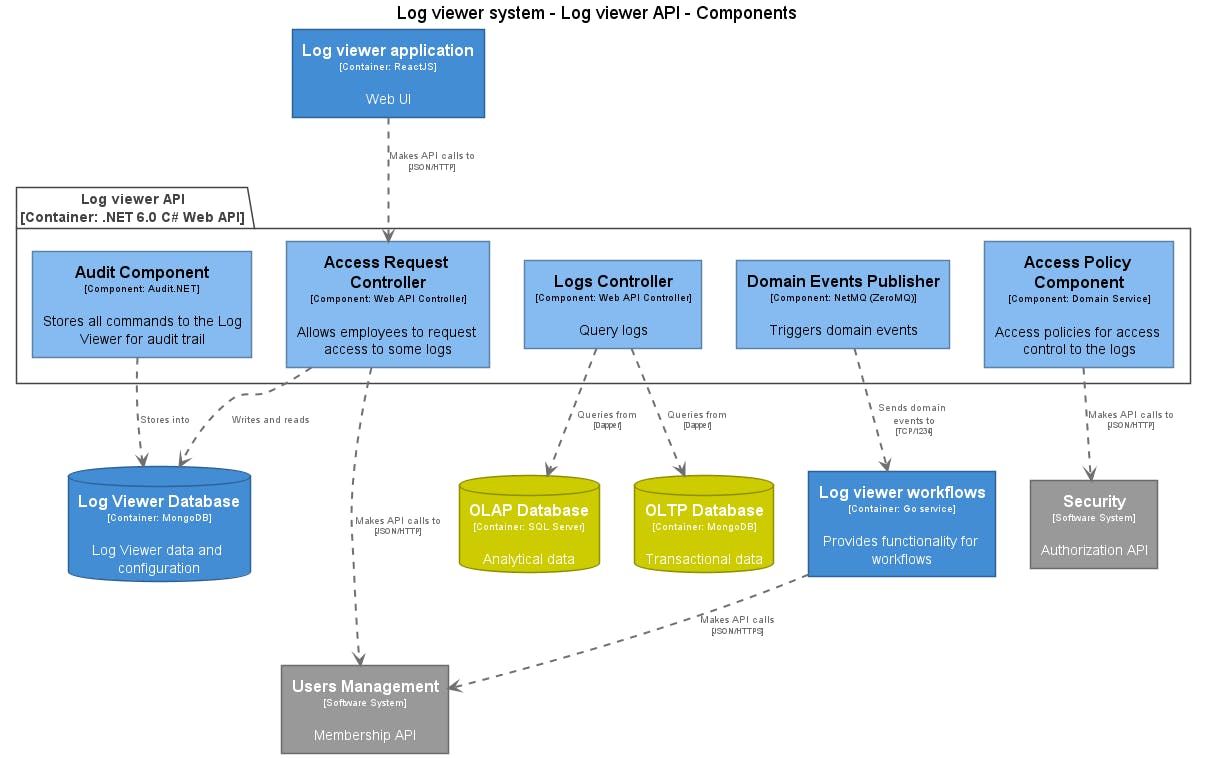
And one more level in the available views:
Styles and Themes
In the provided text version of examples, you saw grey shapes, but on images, it was nicely colored. You can apply styles to your diagrams just akin to CSS. Just paste this code inside a views section, jest below all the component descriptions:
styles {
            element "Person" {
                color #ffffff
                fontSize 22
                shape Person
            }
            element "User" {
                background #08427b
            }
            element "Admin" {
                background #009966
            }
            element "Employee" {
                background #999999
            }
            element "Software System" {
                background #1168bd
                color #ffffff
            }
            element "Existing System" {
                background #999999
                color #ffffff
            }
            element "Container" {
                background #438dd5
                color #ffffff
            }
            element "Web Browser" {
                shape WebBrowser
            }
            element "Database" {
                shape Cylinder
            }
            element "External Database" {
                shape Cylinder
                background #cccc00
            }
            element "Component" {
                background #85bbf0
                color #000000
            }
        }
More to that, there are various themes available for different shapes like Amazon Web Services, Google Cloud Platform, or Microsoft Azure. You can even create your own themes!
Source Code
Any fool can write code that a computer can understand. Good programmers write code that humans can understand.
© Martin Fowler
It is also possible to use the C4 model for describing source code via code diagrams. In that sense, C4 relies on existing notations such as UML, ERD.
But I find it a bit overwhelming. On the source code level, I strive to make the codebase easy to read and use comments on interface methods, functions, or file headers to explain the context and meaning. This saves time for the code reader because most of the time people read code than write. You should be able to express your ideas clearly with the programming language of your choice, instead of putting comments between the lines. However, for some complex logic or low-level code intelligent comments are always a way to go.
Challenges
There is a classical challenge with documentation - keeping it up to date. It is a hard question and you need to find a solution for your team or your company. You can start with diagrams as text and evolve to diagrams as code which could give you options for component discovery via static analysis, parsing distributed log files, etc., to create data-driven software architecture diagrams. Also you can automate and incorporate documentation as a part of your process (PR reviews, CI/CD)
Summary
Documentation is a fairly complex topic. Keeping it in a balance between we don't need it, and going into the jungle of bureaucracy is hard. Here are a few tips:
- Use diagrams as text/code for documenting high-level architecture
- Use source version control and PRs to keep track of changes and verify it
- Use Wiki for how-tos and other important things
- Keep source code readable and clean with meaningful comments when needed
- Use readme files in your repositories with Get Started guides
I recommend having just enough documentation to keep your product afloat and be valuable to the team and the next generation of developers who will work on it after you go.
Resources
leanpub.com/b/software-architecture
c4model.com
structurizr.org
diagrams.mingrammer.com